Distribution
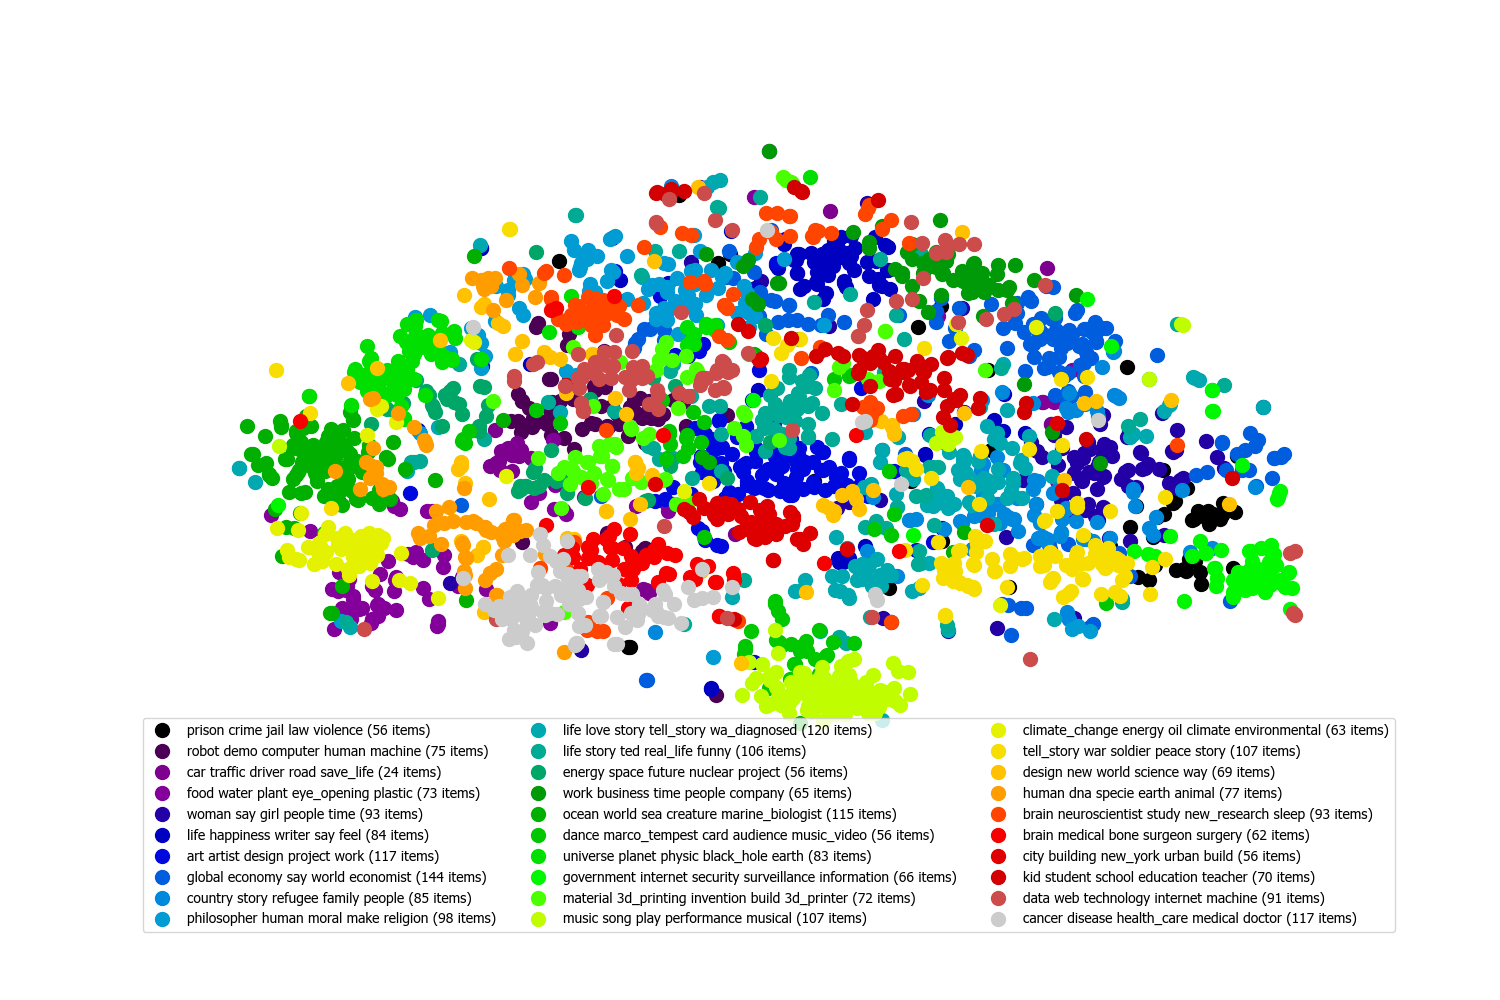
This plot shows the distribution of the text items. Each point is a single item. Points that are close together are have similar meanings. Isolated groups of points indicate high cohesion, that is, the items share a clear set of related topics. More scattered groups indicate lower cohesion, i.e. a greater diversity of topics.
[ Methodology ]
Semantic text embeddings (document vectors) are generated for each item using Universal Sentence Encoder[1], the cosine distances between embeddings are then calculated and t-SNE[2] is used to reduce to two dimensions for visualisation.
The items are colour coded by the category generated using Artificial Intelligence (AI). The names for each category are made up of keywords.
The Artificial Intelligence algorithm categorises the data into the desired number of categories with the aim of having each category be as cohesive (focused) as possible. This means that the most common and closely related topics make up the centers of categories, and then other topics are included in the most closely related category.
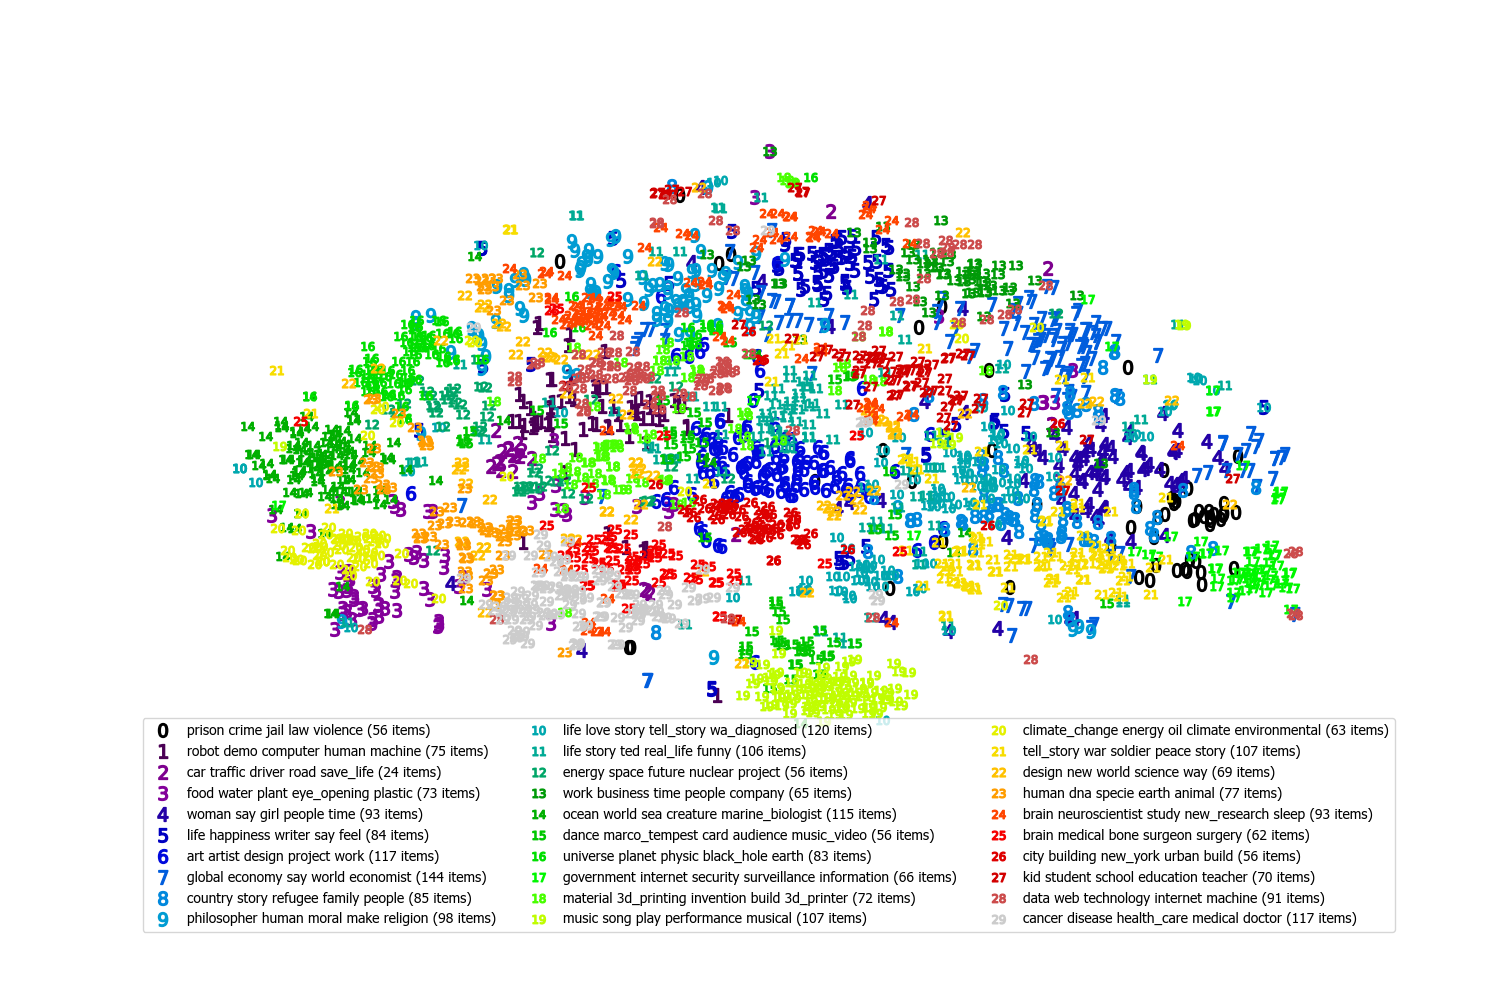
[ Methodology ]
Semantic text embeddings (document vectors) are generated for each item using Universal Sentence Encoder[1], the cosine distances between embeddings are then calculated and K-Means clustering[3] is used to generate 20 clusters. Keywords for each cluster are then extracted using TF-IDF[4].
The text content of the items can be inspected in the interactive plot linked below.
Summaries
Select a category to see a summary.
Note: Multiple points may be from the same item.
[ Methodology ]
Item text is cleaned, split into sentences, and grouped by category, then a variation of the TextRank algorithm [5] is applied to each group and the highest scoring sentences are kept, up to a word limit of 150. The categories are the same as discussed in the previous section.
Acknowledgements
These results were generated using the Text Insights Pipeline. The software was created by David Ralph [A] at the University of Southampton [B] .
The software authors claim no ownership over the dataset. The dataset content and resulting analysis do not necessarily reflect the views of the software authors.
References
- Cer D, Yang Y, Kong Sy, Hua N, Limtiaco N, St. John R, Constant N, Guajardo-Cespedes M, Yuan S, Tar C, Strope B, Kurzweil R (2018) Universal Sentence Encoder for English. In: Proceedings of the 2018 conference on empirical methods in natural language processing System demonstration. Association for Computational Linguistics, Stroudsburg, PA, USA, pp 169–174. https://doi.org/10.18653/v1/D18-2029
- Maaten LVD, Hinton G (2008) Visualizing data using t-SNE. J Mach Learn Res 9:2579–2605
- MacQueen, J. (1967) Some Methods for Classification and Analysis of Multivariate Observations. Proceedings of the 5th Berkeley Symposium on Mathematical Statistics and Probability, 1, 281-297.
- SPARCK JONES, K. (1972). A STATISTICAL INTERPRETATION OF TERM SPECIFICITY AND ITS APPLICATION IN RETRIEVAL. Journal of Documentation, 28(1), 11–21. https://doi.org/10.1108/eb026526
- Federico Barrios, Federico L´opez, Luis Argerich, Rosita Wachenchauzer (2016). Variations of the Similarity Function of TextRank for Automated Summarization, https://arxiv.org/abs/1602.03606